How much renewable electricity is the UK using? Find out with Drax Electric Insights
29th May 2020
While Great Britain moves towards a net zero carbon future, the energy mix and technologies we use are changing at a rapid pace.
We all have a role to play in supporting this transition, with businesses and energy providers at the forefront of this renewable energy revolution. Previously, only those close to the technical sources could see information about the sources of electricity powering our businesses and homes.
Introducing: Drax Electric Insights, the online tool which lets everyone see exactly what’s powering Great Britain, including renewable energy and low carbon power, right now.

What is Electric Insights?
Electric Insights provides data visualisation and analysis of supply, demand, price and environmental impact of Great Britain’s electricity. Created by Drax, it uses only publicly available data, meaning it’s an independent and transparent source, with analysis supported by academic researchers.
View the website to see things like:
- Which energy sources we’re using right now, across the country
- Current electricity demand
- Current power prices
- The environmental impact of generation
Then there’s the full Electric Insights dashboard. Here, you can view historical data, and toggle with options to see what you’re most interested in viewing.
How to find out how much renewable energy powered the first three months of 2020
There are many ways you can use the Electric Insights data. Follow these steps on your computer or tablet in landscape view to see how much renewable energy powered Great Britain throughout the first three months of the year.
Step 1: Set your dates
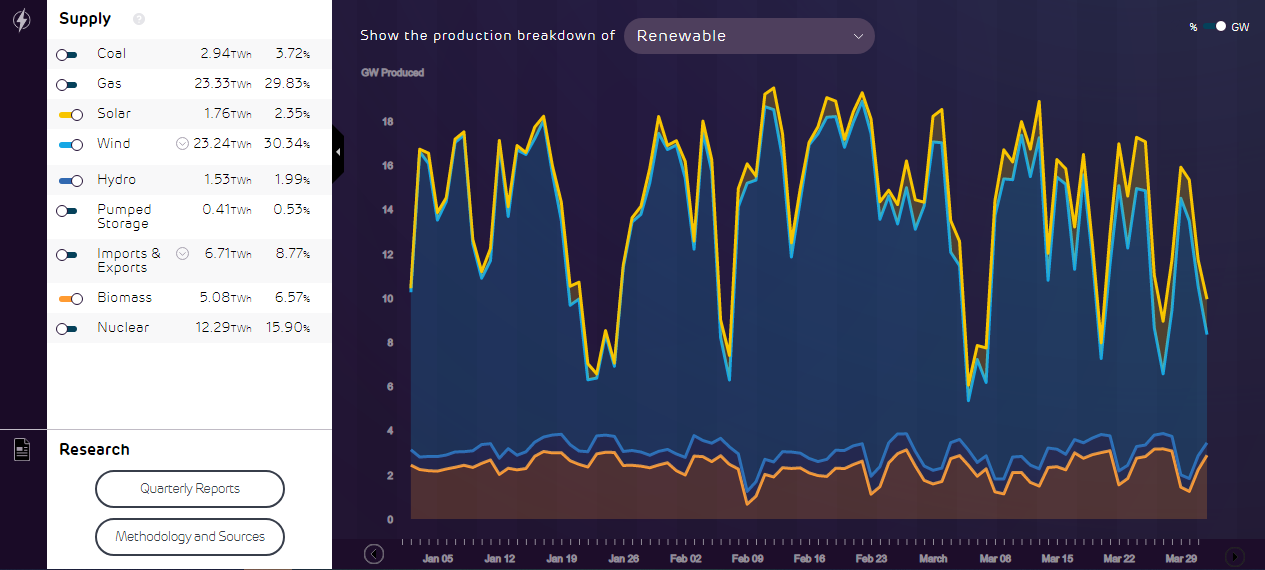
Use the drop-down menu at the top to select Sum, for 3 months, from 01/01/2020 – this will show the sum of all energy generation from 1st January, to 31st March.

Step 2: Set to renewable sources
To show only renewable source generation, set the dropdown ‘Show the production breakdown of’ to ‘Renewable’.
This will reset the graph to show only solar, wind, hydro and biomass energy generation.

Step 3: Analyse the data
Once you’ve done steps 1 and 2, you can begin analyse the data. For example, we can see that in Q1 the breakdown of renewable energy generation was:
- Solar – 2.35%
- Wind – 30.34%
- Hydro – 1.99%
- Biomass – 6.57%
Meaning throughout the first 3 months of 2020, Great Britain was supplied by 41.25% renewable supply, and wind was our highest source of energy, producing 12.24TWh of energy.
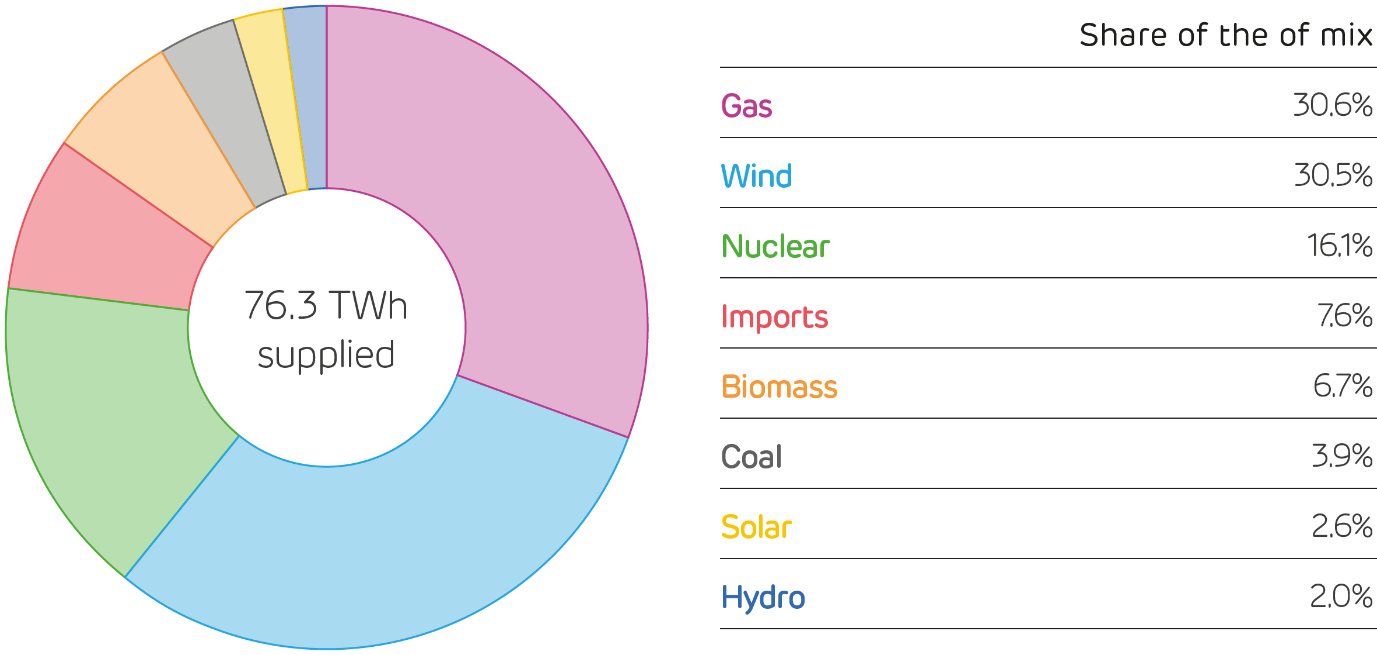
To see the full breakdown of GB energy supply for January to March, see the pie chart below, taken from the latest Electric Insights report.

Download the full Electric Insights report with the button below.
Download Electric Insights ReportRelated articles

UK reaches a new coal-free record amidst Coronavirus lockdown
Despite the challenging times we all find ourselves in across the UK right now, there is some positive news. On 28 April, Great Britain...

Biomass: The renewable energy source supporting the zero-carbon transition
You’ve heard of wind power; you’ve heard of solar power - you may have even heard of geothermal and hydropower. But what do you...

The ultimate guide to renewable energy sources
Electricity generated from algae. Heat harnessed from the depths of the Earth’s core. There’s more to renewable energy than wind turbines and solar panels...